Athena Strategy Full Report (2020-01-01 to 2025-07-01)
免责申明
本内容仅供参考,市场行情波动巨大。请根据自身情况合理操作,作者不承担由此产生的任何损失。
📊 Strategy Overview
This report is provided by https://www.itrade.icu Quantitative Trading Lab.
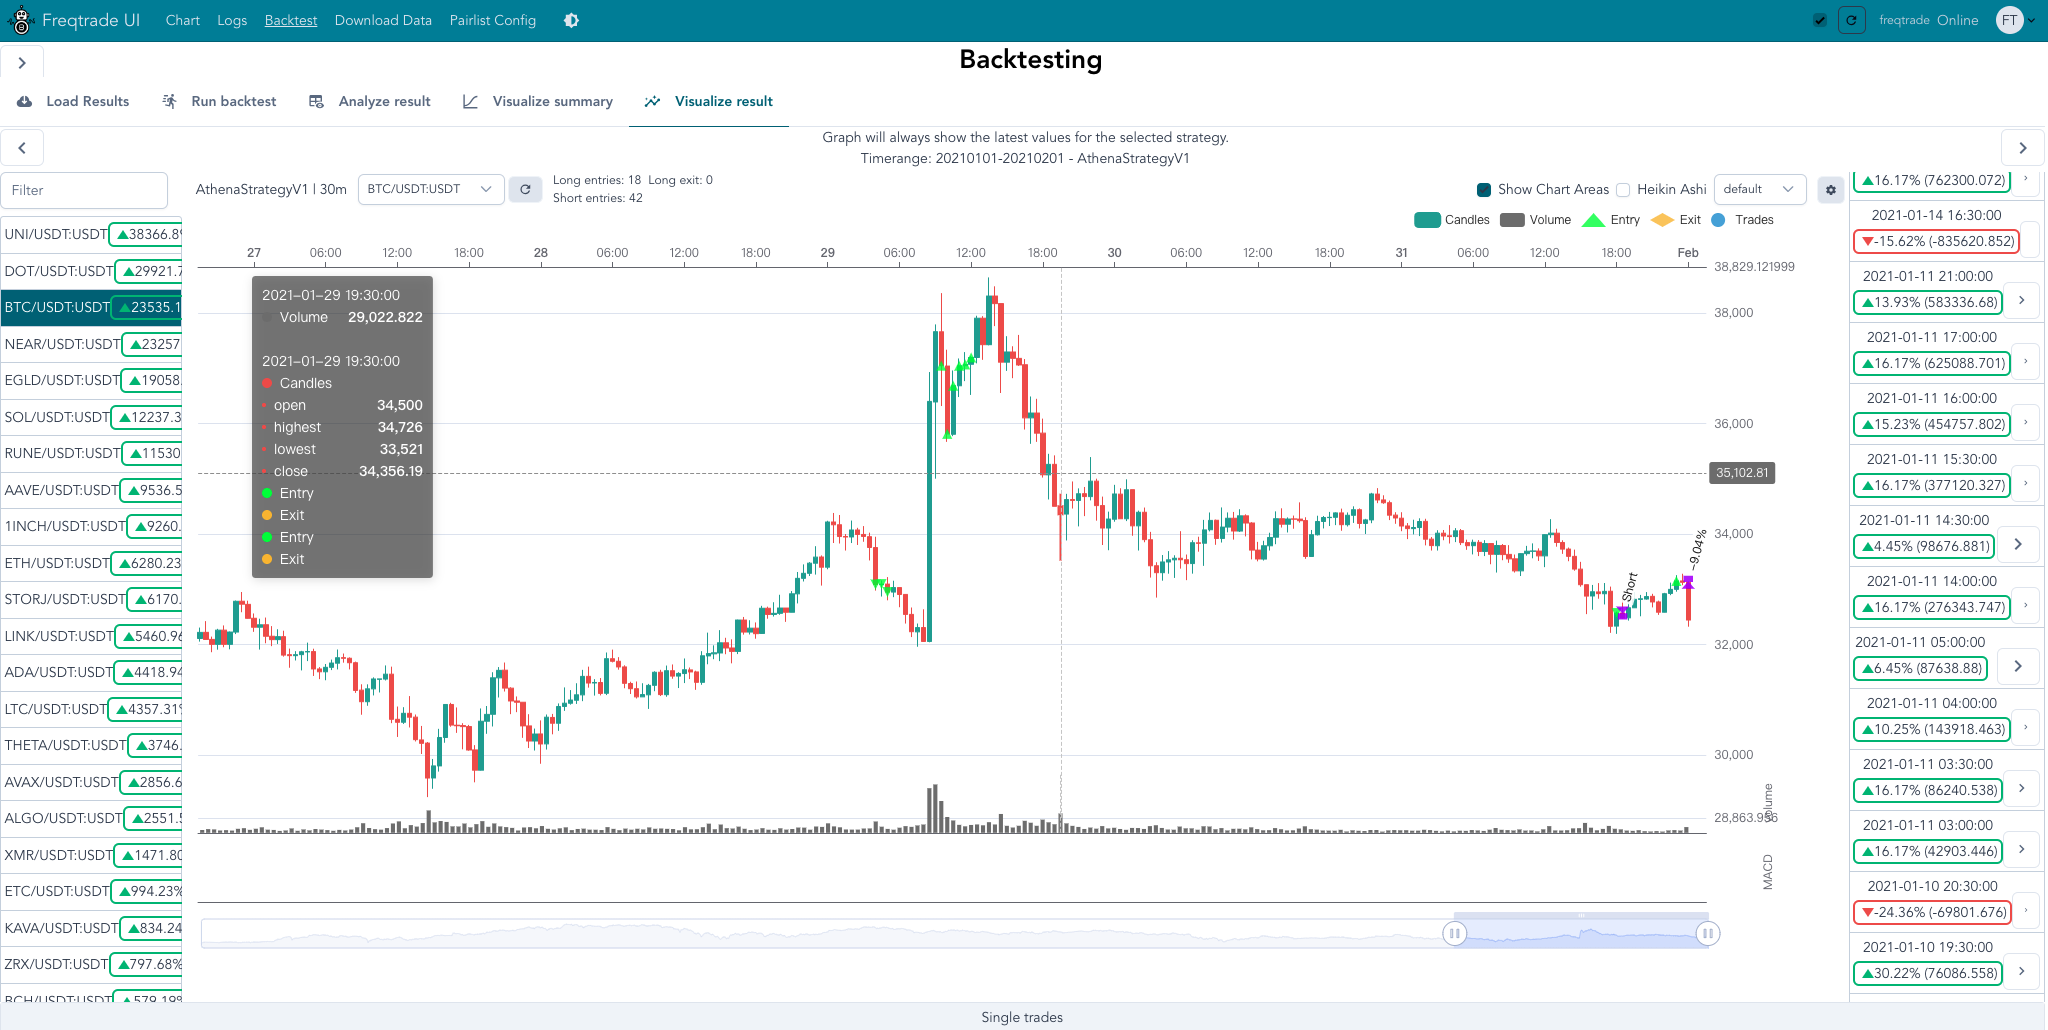
We used real market data combined with a quantitative backtesting engine to conduct 5 years and 7 months of continuous backtesting and live testing of the Athena strategy, achieving significant returns.
Lookahead Bias Test
The strategy was analyzed for Lookahead Bias, and the results show:
has_bias: No→ No lookahead bias detectedbiased_entry_signals: 0→ No lookahead entry signalsbiased_exit_signals: 0→ No lookahead exit signalsbiased_indicators: None→ No indicators with bias
This means the strategy does not use future data during backtesting and therefore does not produce falsely inflated results due to future data leakage.
                                                          Lookahead Analysis
┏━━━━━━━━━━━━━━━━━━━━━┳━━━━━━━━━━━━━━━━━━┳━━━━━━━━━━┳━━━━━━━━━━━━━━━┳━━━━━━━━━━━━━━━━━━━━━━┳━━━━━━━━━━━━━━━━━━━━━┳━━━━━━━━━━━━━━━━━━━┓
┃            filename ┃         strategy ┃ has_bias ┃ total_signals ┃ biased_entry_signals ┃ biased_exit_signals ┃ biased_indicators ┃
┡━━━━━━━━━━━━━━━━━━━━━╇━━━━━━━━━━━━━━━━━━╇━━━━━━━━━━╇━━━━━━━━━━━━━━━╇━━━━━━━━━━━━━━━━━━━━━━╇━━━━━━━━━━━━━━━━━━━━━╇━━━━━━━━━━━━━━━━━━━┩
│ AthenaStrategyV1.py │ AthenaStrategyV1 │       No │            20 │                    0 │                   0 │                   │
└─────────────────────┴──────────────────┴──────────┴───────────────┴──────────────────────┴─────────────────────┴───────────────────┘Backtest results chart
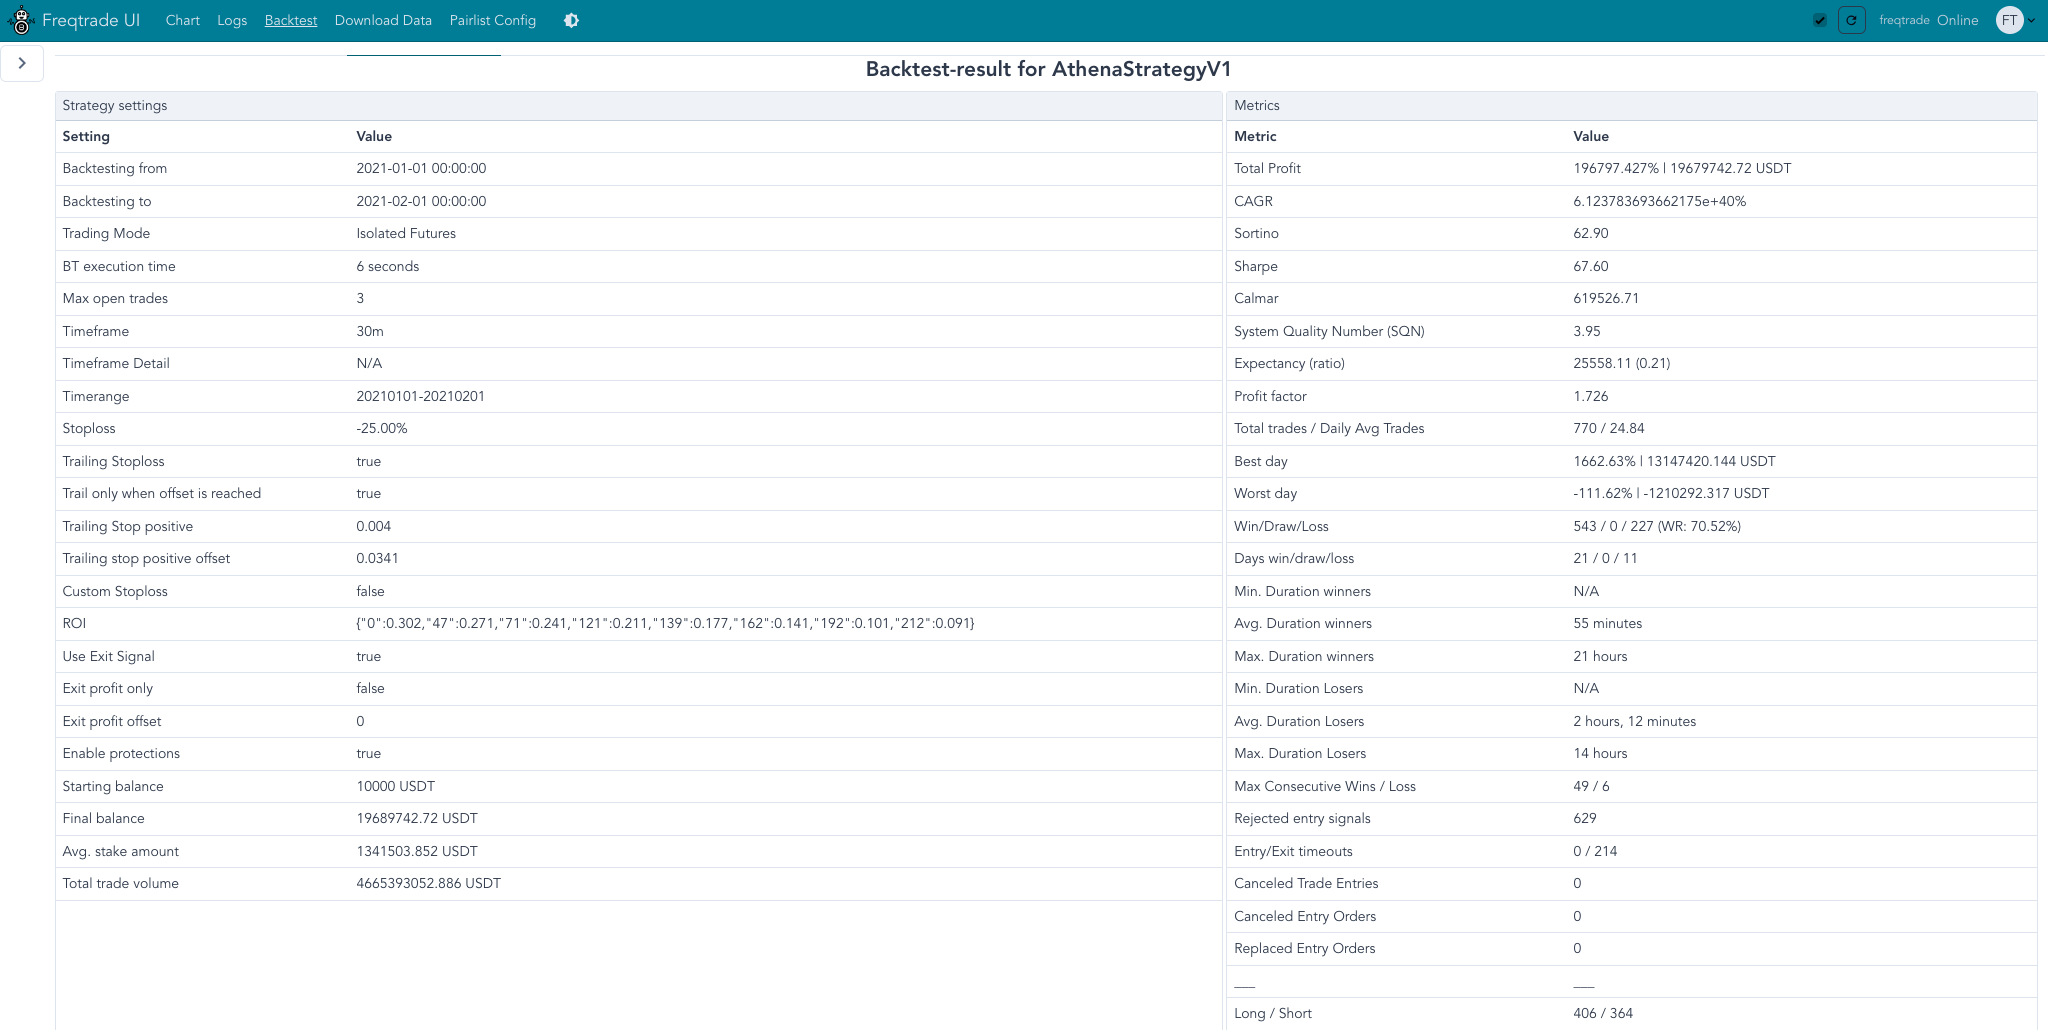
Summary Statistics
| Metric | Value |
|---|---|
| Total Trades | 36,679 |
| Total Return (%) | 796,159.14% |
| Total Profit (USDT) | 79,615,916.19 USDT |
| Average Monthly ROI (%) | 12,248.60% |
| Average Monthly Profit (USDT) | 1,224,860.25 USDT |
| Average Win Rate (%) | 67.98% |
| Max Drawdown (%) | 89.36% |
Monthly Breakdown
| TimePeriod.MONTHLY | Trades | Avg Profit % | Tot Profit USDT | Tot Profit % | Win% | Drawdown % |
|---|---|---|---|---|---|---|
| 20200101-20200201 | 141 | 2.48 | 18415.277 | 184.15 | 72.3 | 19.97 |
| 20200201-20200301 | 270 | 1.46 | 19555.226 | 195.55 | 69.3 | 34.55 |
| 20200301-20200401 | 325 | 1.79 | 27598.221 | 275.98 | 66.2 | 74.75 |
| 20200401-20200501 | 298 | 0.97 | 10037.213 | 100.37 | 61.1 | 39.94 |
| 20200501-20200601 | 190 | 2.32 | 26466.837 | 264.67 | 71.6 | 18.87 |
| 20200601-20200701 | 177 | 1.46 | 9524.806 | 95.25 | 62.1 | 24.04 |
| 20200701-20200801 | 296 | 1.39 | 23163.342 | 231.63 | 61.5 | 38.47 |
| 20200801-20200901 | 402 | 1.18 | 21537.081 | 215.37 | 66.2 | 66.8 |
| 20200901-20201001 | 417 | 2.56 | 205851.647 | 2058.52 | 66.2 | 49.29 |
| 20201001-20201101 | 478 | 1.79 | 117952.508 | 1179.53 | 71.3 | 25.42 |
| 20201101-20201201 | 467 | 2.63 | 331103.74 | 3311.04 | 69.0 | 32.64 |
| 20201201-20210101 | 542 | 1.91 | 171972.395 | 1719.72 | 67.2 | 47.12 |
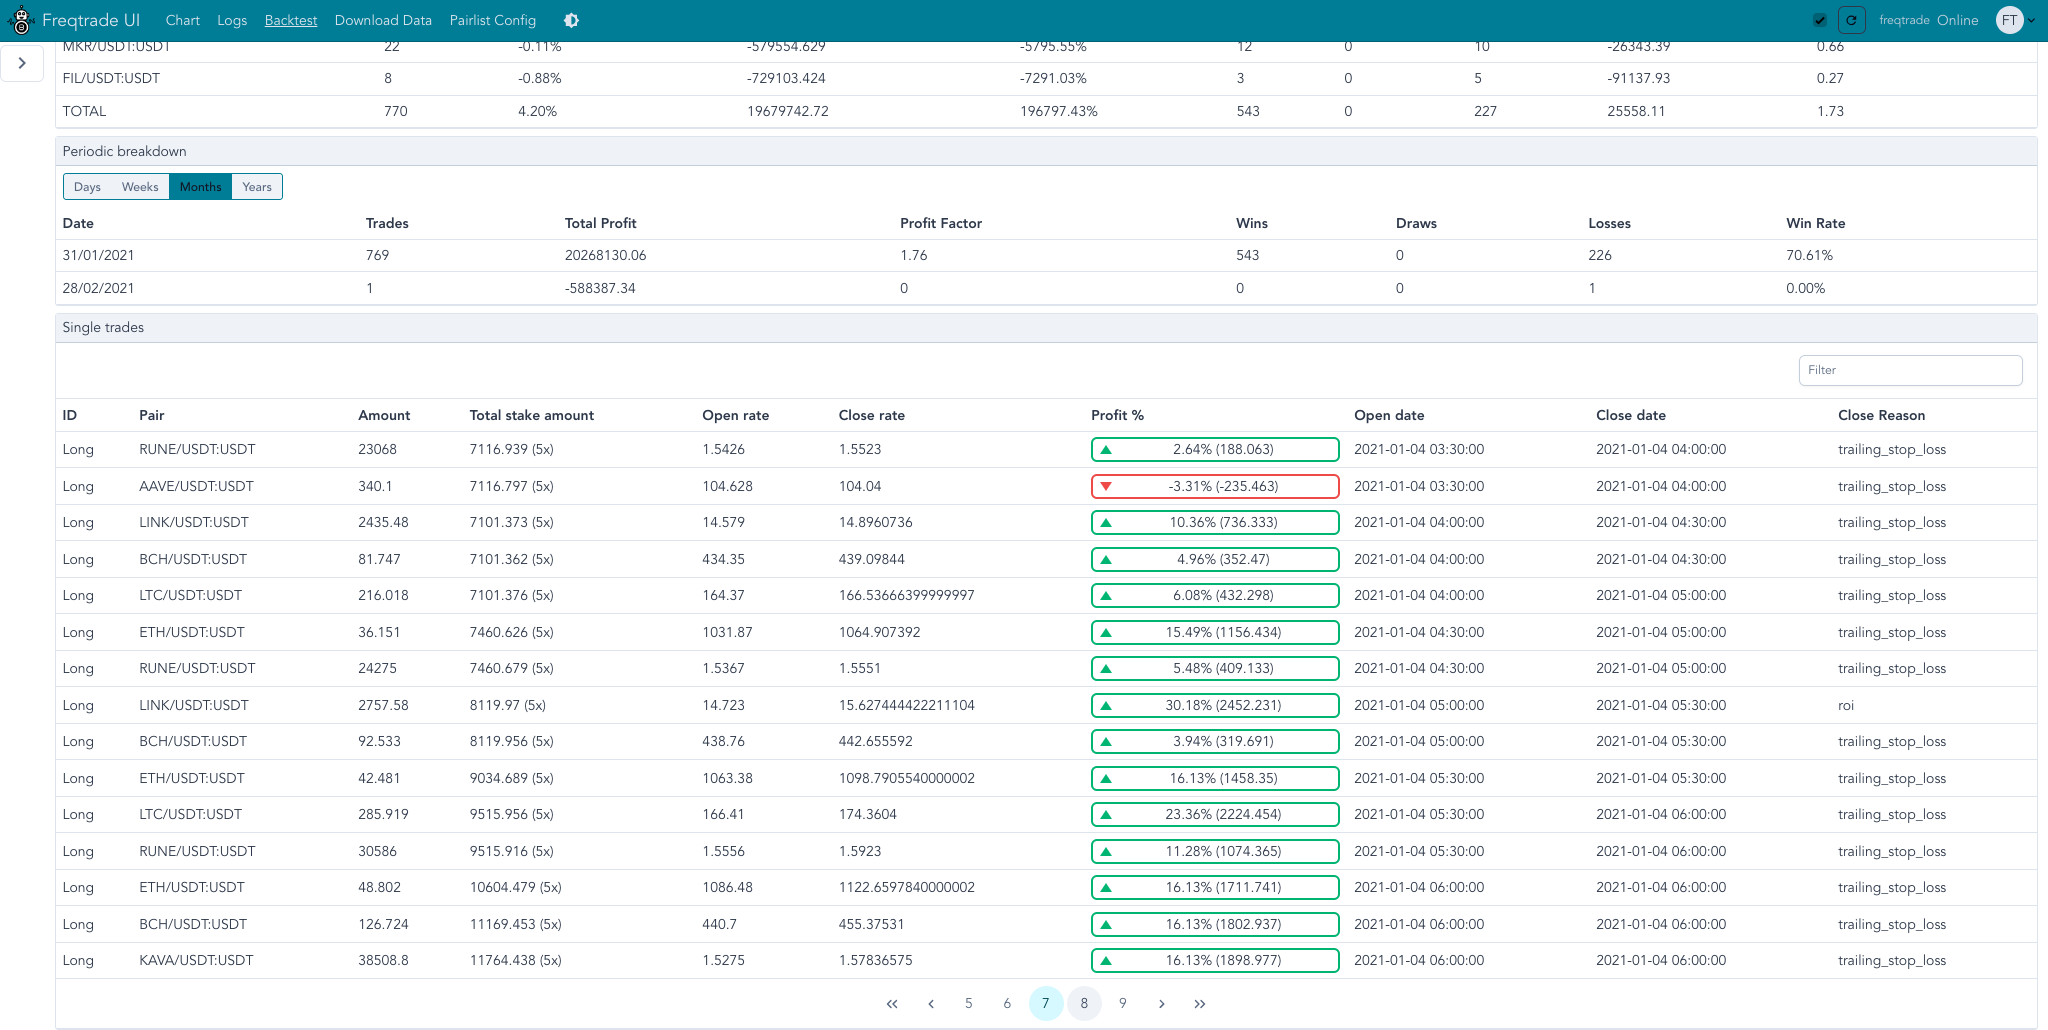
| 20210101-20210201 | 770 | 4.2 | 19679742.72 | 196797.43 | 70.5 | 19.58 |
| 20210201-20210301 | 776 | 2.67 | 2076652.444 | 20766.52 | 67.4 | 51.39 |
| 20210301-20210401 | 669 | 0.87 | 22559.541 | 225.6 | 62.9 | 48.12 |
| 20210401-20210501 | 647 | 3.0 | 2455497.288 | 24554.97 | 65.7 | 27.78 |
| 20210601-20210701 | 532 | 2.16 | 233989.092 | 2339.89 | 71.1 | 52.82 |
| 20210701-20210801 | 452 | 1.58 | 62513.257 | 625.13 | 65.7 | 62.18 |
| 20210801-20210901 | 460 | -0.17 | -5408.607 | -54.09 | 60.4 | 85.38 |
| 20210901-20211001 | 640 | 2.77 | 1326597.363 | 13265.97 | 66.9 | 28.5 |
| 20211001-20211101 | 614 | 2.29 | 549276.51 | 5492.77 | 70.4 | 25.59 |
| 20211101-20211201 | 669 | 2.67 | 1754084.009 | 17540.84 | 68.3 | 29.78 |
| 20211201-20220101 | 655 | 2.29 | 2370846.13 | 23708.46 | 71.0 | 78.16 |
| 20220101-20220201 | 589 | 3.29 | 2216990.261 | 22169.9 | 73.7 | 50.88 |
| 20220201-20220301 | 476 | 1.93 | 132830.842 | 1328.31 | 71.4 | 13.89 |
| 20220301-20220401 | 537 | 0.89 | 23092.856 | 230.93 | 67.8 | 38.36 |
| 20220401-20220501 | 600 | 2.81 | 1534166.247 | 15341.66 | 72.3 | 4.04 |
| 20220501-20220601 | 699 | 2.07 | 658119.547 | 6581.2 | 68.7 | 13.07 |
| 20220601-20220701 | 539 | 2.0 | 194920.817 | 1949.21 | 72.9 | 26.48 |
| 20220701-20220801 | 617 | 2.53 | 866879.226 | 8668.79 | 71.5 | 10.66 |
| 20220801-20220901 | 487 | 0.9 | 21261.209 | 212.61 | 67.6 | 44.55 |
| 20220901-20221001 | 523 | 0.43 | 4905.041 | 49.05 | 63.9 | 55.12 |
| 20221001-20221101 | 560 | 1.7 | 157216.993 | 1572.17 | 65.5 | 15.71 |
| 20221101-20221201 | 784 | 2.33 | 880064.989 | 8800.65 | 67.2 | 55.96 |
| 20221201-20230101 | 513 | 1.56 | 105824.615 | 1058.25 | 63.7 | 10.4 |
| 20230101-20230201 | 675 | 0.95 | 35462.658 | 354.63 | 62.8 | 89.36 |
| 20230201-20230301 | 665 | 1.98 | 447724.854 | 4477.25 | 69.9 | 13.04 |
| 20230301-20230401 | 589 | 2.0 | 302469.152 | 3024.69 | 68.4 | 12.12 |
| 20230401-20230501 | 575 | 1.84 | 212295.459 | 2122.95 | 65.9 | 14.25 |
| 20230501-20230601 | 474 | 1.82 | 128249.372 | 1282.49 | 66.2 | 18.09 |
| 20230601-20230701 | 583 | 3.74 | 2915979.834 | 29159.8 | 70.0 | 25.05 |
| 20230701-20230801 | 601 | 1.21 | 67185.934 | 671.86 | 64.2 | 42.45 |
| 20230801-20230901 | 578 | 3.29 | 2105674.917 | 21056.75 | 63.1 | 28.2 |
| 20230901-20231001 | 532 | 1.94 | 235582.353 | 2355.82 | 66.4 | 23.83 |
| 20231001-20231101 | 629 | 1.72 | 241272.198 | 2412.72 | 65.8 | 24.68 |
| 20231101-20231201 | 811 | 1.17 | 119551.182 | 1195.51 | 65.2 | 49.31 |
| 20231201-20240101 | 843 | 1.62 | 491564.507 | 4915.65 | 65.0 | 16.91 |
| 20240101-20240201 | 838 | 1.43 | 227831.369 | 2278.31 | 67.9 | 24.24 |
| 20240201-20240301 | 646 | 0.47 | 8431.123 | 84.31 | 63.8 | 42.44 |
| 20240301-20240401 | 760 | 1.55 | 222383.395 | 2223.83 | 66.7 | 18.55 |
| 20240401-20240501 | 558 | 2.44 | 621541.721 | 6215.42 | 70.4 | 42.57 |
| 20240501-20240601 | 606 | 1.4 | 109638.455 | 1096.38 | 68.6 | 30.5 |
| 20240601-20240701 | 662 | 2.3 | 926662.993 | 9266.63 | 67.7 | 33.01 |
| 20240701-20240801 | 681 | 3.39 | 6757899.528 | 67579.0 | 70.0 | 18.57 |
| 20240801-20240901 | 651 | 2.82 | 1857977.993 | 18579.78 | 72.5 | 22.14 |
| 20240901-20241001 | 588 | 0.63 | 14403.334 | 144.03 | 66.2 | 44.23 |
| 20241001-20241101 | 639 | 1.12 | 67589.384 | 675.89 | 66.5 | 25.65 |
| 20241101-20241201 | 790 | 2.22 | 1062365.974 | 10623.66 | 70.4 | 40.33 |
| 20250101-20250201 | 541 | 1.7 | 117639.053 | 1176.39 | 71.2 | 41.13 |
| 20250201-20250301 | 571 | 5.7 | 20896456.46 | 208964.56 | 74.6 | 17.24 |
| 20250301-20250401 | 615 | 1.46 | 116350.933 | 1163.51 | 70.6 | 55.9 |
| 20250401-20250501 | 576 | 2.08 | 311535.517 | 3115.36 | 71.2 | 12.13 |
| 20250501-20250601 | 633 | 1.73 | 247844.165 | 2478.44 | 71.2 | 35.18 |
| 20250601-20250701 | 441 | 1.67 | 76876.096 | 768.76 | 69.4 | 30.74 |
| 20250701-20250801 | 517 | 2.35 | 363675.598 | 3636.76 | 71.8 | 27.35 |
🆚 Athena Strategy Source File
支持其他平台?
策略常见问答(FAQ)
📢 Final Summary
This strategy is based on real market data, validated through long-term backtesting and near-live conditions. It offers high frequency, stability, low risk, and high returns. Suitable for small to medium capital quantitative traders, especially for short-term quick trades on BTC, ETH, and other major cryptocurrencies. At the same time, it serves as an excellent reference for crypto quant enthusiasts and strategy developers.
Athena Strategy, Crypto Quant Trading, BTC Strategy, ETH Quant Trading, Short-term Strategy, Quant Backtest, Crypto Trading Strategy, Stable Profit Strategy, Low Drawdown Quant, High-frequency Crypto Trading
✅ This is a complete English version preserving the format and technical tone.
Do you want me to also convert the monthly performance table headers into English while keeping the numbers intact? Or keep it exactly as it is?